Tracking the ISS: Why Its Orbit, Altitude and Speed Constantly Change
Watch the International Space Station on a live tracker for thirty seconds and three things stop being abstract. The bright dot sliding across the map is moving fast enough to cross the Atlantic in nine minutes. Its altitude line is not flat. Its velocity line is not flat either. Every time the altitude dips, the velocity ticks up. Every time the altitude climbs, the velocity drops. The two graphs look like inverted twins, breathing against each other.
Nothing on those graphs is a glitch. They are showing real orbital mechanics, the same ones Isaac Newton wrote down in 1687 and Pierre-Simon Laplace tightened up a century later. The ISS is not "above" the atmosphere so much as it is falling around the planet, and the shape and energy of that fall is what the dials on issinfo.net are sketching live.
This post is for anyone who has ever wondered what is really going on in those wiggles, why the ground track is a wave instead of a circle, why the orbit is tilted at such an odd angle, and how the people in mission control keep the whole structure from quietly sinking into the sky.
The numbers, anchored
The ISS sits in low Earth orbit at a working altitude of roughly 400 km. As of mid-May 2026, the Wikipedia infobox quotes its perigee at 413 km and its apogee at 422 km, with an orbital eccentricity of 0.0002267. That is about as close to a perfect circle as a real orbit ever gets. Its inclination is 51.64 degrees, which means it never flies higher than the latitude of Saratov, Russia, or the southern Falkland Islands, and never lower in the opposite hemisphere.
At that altitude it moves at 7.67 km/s, or 27,600 km/h, or 17,100 mph. Pick whichever unit makes your stomach drop. It completes one full orbit in 92.9 minutes, which works out to roughly 15.5 laps of the planet every day. The crew sees 16 sunrises and 16 sunsets in every working shift, which is one of the reasons the station runs on Coordinated Universal Time instead of a local clock. A calendar that ticks every 90 minutes is no calendar at all.
| Parameter | Value | Source |
|---|---|---|
| Mean altitude | 413 to 422 km | Wikipedia infobox (May 2026) |
| Inclination | 51.64 degrees | Wikipedia infobox |
| Orbital speed | 7.67 km/s (27,600 km/h, 17,100 mph) | Heavens-Above ephemeris |
| Orbital period | 92.9 minutes | Wikipedia infobox |
| Eccentricity | 0.0002267 | Wikipedia infobox |
| Orbits per day | 15.5 | NASA |
| Average altitude decay | About 2 km per month | NASA |
| Annual reboost propellant | About 7.5 tonnes, ~$210 million | Wikipedia |
These are the numbers that the live map turns into a moving picture.
The ground track: why the line is a wave
![]() Live tracking page at issinfo.net. The green ground track is the station's path projected onto a flat map. The altitude (yellow) and velocity (blue) traces below it are inversely correlated, by physics.
Live tracking page at issinfo.net. The green ground track is the station's path projected onto a flat map. The altitude (yellow) and velocity (blue) traces below it are inversely correlated, by physics.
The wavy green line on the map is the ground track, the point directly under the ISS as it orbits. It looks like a sine wave for two reasons that have nothing to do with the station wiggling about.
The first is inclination. The ISS orbits in a plane tilted 51.64 degrees to the equator. That angle is not a design choice driven by physics; it is a Cold War compromise. Russia's Baikonur Cosmodrome sits at about 46 degrees north, and Soyuz and Progress rockets cannot launch into a less-tilted orbit without overflying China or dropping spent stages on inhabited ground. The 51.6-degree orbit was the lowest inclination that could be reached safely from Baikonur. China's Tiangong station, launched from Wenchang at 19 degrees north, has the freedom to orbit at 41.5 degrees, hugging the equator more closely. Inclination, in other words, is geography.
The second reason is Earth's rotation. The planet spins underneath the orbit, eastward, at about 15 degrees per hour. While the ISS takes 93 minutes to complete one lap, the Earth turns roughly 22.5 degrees beneath it. Each time the station crosses the equator going north, that crossing point has shifted westward of the previous one. Plot enough orbits and the map fills with overlapping sine waves marching west, the trace of a station that flies in a straight (curved) line while the ground beneath it slides east.
Project that path onto a flat map and you get the ground track as drawn. The orbit itself is a near-perfect circle inclined to the equator; the wave is an artifact of how a globe gets unrolled onto a rectangle. The good news is that the artifact is informative: the wave shows the crew passing over about 90 percent of the world's inhabited land at some point in each day, which is why so many people get a chance to look up at dawn or dusk and watch a bright point go over. Use the Next Pass tool on issinfo.net to find out when it next passes near you.
Falling sideways, fast enough to miss
The reason the ISS does not simply fall down is that it is moving sideways too fast. Gravity at 400 km up is still about 90 percent as strong as on Earth's surface; the famous "weightless" feeling on board is not the absence of gravity but the presence of continuous freefall. The crew, the station, and the half-drunk pouches of espresso are all falling toward the planet at the same rate, so nothing presses against anything else. Inside, that registers as zero G. Outside, the station is following a curved path because as it falls, the ground curves away beneath it just as fast.
The arithmetic is almost embarrassingly compact. For a circular orbit, balancing gravity against the centripetal pull gives:
$$v = \sqrt{\frac{GM}{R}}$$
where G is Newton's gravitational constant, M is the mass of the Earth and R is the distance from the centre of the Earth (not the surface). Plug in Earth's radius of 6,371 km plus 415 km of altitude, and v comes out to about 7.66 km/s. That matches what the tracker shows because that is what the equation insists on. There is essentially one correct speed for a given orbital height. Move slower and gravity wins, dragging the station to a lower, faster orbit. Move faster and the orbit climbs higher, where the necessary speed is lower again. Speed and altitude are locked together by maths.
Why the altitude line and velocity line breathe in opposition
Even at an eccentricity of 0.0002267, the ISS orbit is not a perfect circle. It is a slightly squashed one, with a perigee (closest point to Earth) and an apogee (farthest point) about 9 km apart on the current Wikipedia figures. The station spends each lap easing from its low point to its high point and back again.
Johannes Kepler worked out the consequence in 1609: a satellite on an elliptical orbit moves faster near perigee and slower near apogee. It is the orbital equivalent of a skateboarder in a half-pipe, who is doing 30 km/h at the bottom of the bowl and slowing to a momentary pause at the top. Energy is being traded back and forth between kinetic (speed) and gravitational (height), and the total stays constant.
On the live tracker, this is the source of the perfectly anti-correlated wobble. Whenever the yellow altitude line dips towards perigee, the blue velocity line picks up a few tens of km/h. As the altitude climbs back towards apogee, the velocity bleeds off again. On a quiet day the altitude swing is around 9 to 12 km and the velocity swing is around 20 to 40 km/h. The graphs look noisy if you stare at them; they are actually conducting an orchestra.
This breathing is not corrected. It would cost propellant to flatten it and there is no operational reason to. Mission control lets the orbit be what orbital mechanics says it is.
Atmospheric drag: the orbit is leaking
Now zoom out from the per-orbit wobble to the per-month trend. Average the altitude over a week and you can see it sinking, slowly and remorselessly.
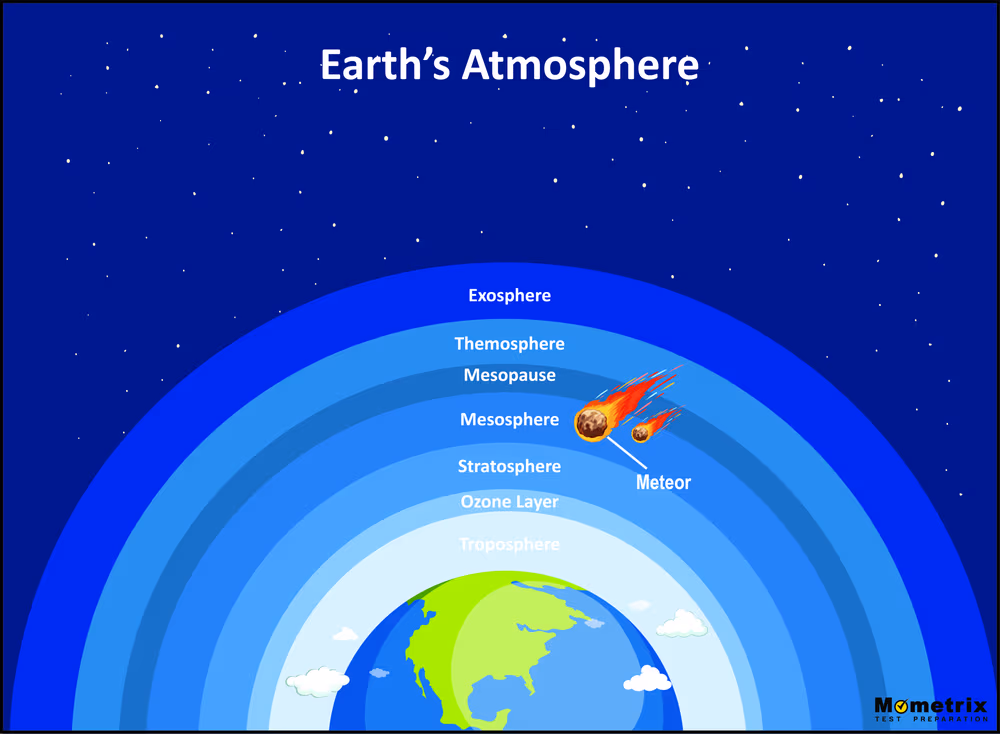 The ISS orbits inside the thermosphere, the upper layer where atmosphere thins out toward the vacuum of space. There is not much air at 400 km, but there is enough to matter.
Low Earth orbit is not actually empty. At 400 km the ISS is flying through the upper thermosphere, where atmospheric density is roughly a trillion times thinner than at sea level but stubbornly non-zero. Each lap, the station ploughs through a few hundred trillion gas molecules. Each collision robs it of a sliver of kinetic energy. The orbital-mechanics consequence of losing kinetic energy is, perversely, to fall to a lower orbit and speed back up at the new altitude.
NASA's published average is that the ISS sheds about 2 km of altitude per month to drag, though the actual figure varies by a factor of two or more depending on three things:
- The orientation of the station. A 109-metre truss with its solar arrays edge-on to the airflow drags less than the same truss with the arrays broadside. Flight controllers actively use a configuration called Night Glider mode, in which the giant USOS solar arrays are rolled parallel to the velocity vector on the eclipsed (night) side of every orbit. There is no sunlight to catch there anyway, and the drag saving over a year is substantial.
- The density of the upper atmosphere at any moment, which is not constant. It puffs up when heated.
- The Sun, which does the heating.
That third point is the wild card.
Solar cycle 25 is squeezing the orbit harder
The Sun runs on an 11-year activity cycle, and the current one, solar cycle 25, peaked in October 2024 with a smoothed sunspot number of 161 (the unsmoothed monthly peak was 216 in August 2024, the highest in over twenty years). The peak has passed, but the smoothed number is still elevated through 2025 and 2026, and SILSO, the Brussels-based sunspot index keeper, notes that a secondary maximum is possible. Cycle 25 was forecast to be weak; it has surprised everyone by running about 30 percent more active than its predecessor.
For low-flying spacecraft, solar maximum is bad news. Higher extreme-ultraviolet output heats the thermosphere. A hotter thermosphere expands outward, so the air at 400 km gets denser. Denser air means more drag, faster decay, more frequent reboosts. NOAA's Space Weather Prediction Center has spent the last two years issuing rolling advisories to satellite operators about increased drag, and the ISS has not been spared. The altitude line on the live tracker has been sliding a bit faster than its long-run average since 2023. The corrective burns have come a little closer together as a result.
Reboost: 7.5 tonnes of fuel a year, give or take
A reboost is exactly what it sounds like: a controlled burn that adds kinetic energy to the orbit, raising the station back to its operating band. The principal source is still the Zvezda service module's main engines on the Russian segment, the same propulsion system Zvezda has been carrying since it launched in 2000. Visiting spacecraft also help: a docked Progress cargo ship can fire its engines from the Zvezda aft port, the European ATV did the same in its day, and since 2018 the American Cygnus freighter has been able to contribute as well.
A typical reboost lasts a few minutes of engine burn, spread across about two orbits (roughly three hours of total manoeuvre time including spin-up and spin-down). The thrust is gentle by rocket standards. The OA-9 demonstration burn on 10 July 2018, Cygnus's first reboost attempt, was 50 seconds long and raised the ISS by about 90 metres. The OA-9 was a feasibility test; since June 2022, when Cygnus NG-17 carried out the first operational commercial reboost, Cygnus has been part of the routine toolkit. The first Cygnus XL, NG-23, launched on 14 September 2025; its successor NG-24 docked at Unity nadir on 13 April 2026 and is on station now, available for boost duties if required.
The annual budget for all this is striking. Maintaining ISS altitude burns roughly 7.5 tonnes of chemical propellant per year, at an annual cost of about $210 million. That is the price of fighting a few hundred trillion gas molecules per orbit, every orbit, for as long as the station stays aloft.
There is a counter-intuitive twist worth pausing on. Boosting the orbit requires adding speed in the velocity direction, which costs energy. But once the station settles into the higher orbit, the orbital speed at that new altitude is slightly lower than before. Higher orbit, slower satellite. To slow down (in steady-state terms), you must briefly speed up. It is the rule that orbital mechanics never lets anyone forget.
If radar tracking spots a piece of orbital debris on a worrying trajectory, the same machinery is used in a different mode, called a Debris Avoidance Manoeuvre. The burn is usually only a metre per second or so, raising or lowering the orbit by a kilometre or two. Better to spend a sip of fuel than risk an impact at 7.67 km/s.
How the live tracker actually knows where it is
A fair question at this point: the dot on the map is real-time, more or less, but the ISS is not transmitting GPS coordinates to issinfo.net every second. How does the tracker keep up?
The answer is the two-line element set, or TLE, a compact format the US Space Force has used since the 1960s to publish the orbital parameters of every catalogued object in orbit. A TLE is two ASCII lines of 69 characters each, plus an optional name line on top. The first line carries an epoch (a precise timestamp) and a drag coefficient; the second carries the six classical orbital elements (inclination, right ascension of the ascending node, eccentricity, argument of perigee, mean anomaly and mean motion). That is enough to reconstruct the entire orbit.
A standard TLE for the ISS, catalogue number 25544, looks like this:
ISS (ZARYA)
1 25544U 98067A   26140.51782528 -.00002182  00000-0 -11606-4 0  9994
2 25544  51.6416 247.4627 0006703 130.5360 325.0288 15.49125391563537
The tracker takes that data, feeds it into a propagator called SGP4 (Simplified General Perturbations, version 4) which dates back to a 1980 NORAD paper, and out comes the predicted position for any time you ask. SGP4 is accurate to about 1 km at epoch, drifting at 1 to 3 km per day as the unmodelled drag and gravitational lumpiness catch up with it. That is why fresh TLEs are republished every few hours, and why the issinfo.net backend pulls a new one from Space-Track several times a day. The dot you see on the map is a real-time prediction against the latest available element set, not a downlink from the station itself. After a reboost, the old TLE is suddenly wrong by several kilometres, and a new one is issued within hours. The graph wobbles for a day or two while the propagator catches up, then settles.
So what should you watch for?
Next time you have the live tracker open, here are the patterns worth waiting for:
- The seesaw. Watch the altitude graph for a few minutes. Whenever it falls, the velocity rises. Whenever it climbs, the velocity drops. The two are mirror images because Kepler said so.
- The slow sag. Over several days the average altitude trends downward. That is drag. Compare a week in 2026 against a week in 2018 and the slope is steeper now, because the Sun is shouting.
- The jump. Roughly once a month, the altitude takes a sudden step upward of two to five kilometres in the span of a few hours. That is a reboost. If you check the Who's in Space page you can usually work out which docked vehicle did the pushing.
- The ground track sweeping west. Each fresh equator crossing is shifted a little further west than the last, because the Earth keeps spinning. Wait one full day (16 orbits) and the pattern almost repeats. Almost.
- The bright dot at dawn. Up there in real life, the station is brighter than any star and most planets when conditions are right. At magnitude minus four it rivals Venus, drifting silently across the sky for two or three minutes. The graphs are nice, but the view is better.
The ISS will keep doing all of this until at least the end of 2030, when the planned US Deorbit Vehicle (a heavily-modified SpaceX Dragon, contract worth up to $843 million) will spend a year docked at Harmony forward port before lowering the orbit one last time. The target date for that final, controlled re-entry over Point Nemo is January 2031. There are arguments in Congress as of February 2026 about whether to boost the station to a higher "safe orbital harbor" instead; nothing is settled. For now, every wobble on the live tracker is the station carrying on with the only job it has ever had: falling around the Earth, fast enough to keep missing.
Related reading
- Five Things You Didn't Know About the International Space Station for the science, plumbing and politics happening inside the station you are tracking.
- Orbiting Awkwardly: Diplomacy on the Space Station for how the partnership that keeps reboosting the ISS has held together through 25 years of terrestrial turmoil.
- Meet the Astrobees for the floating robot helpers that share the Kibo module with the crew.
- The Artemis tracker for the parallel programme NASA hopes will outlast the ISS at the Moon.
Sources: the Wikipedia articles on the International Space Station, Simplified perturbations models, the two-line element set, Solar cycle 25, and the Cygnus spacecraft; NASA's Space Station Facts and Figures; SILSO's Solar Cycle Progression; and live element data from Space-Track via issinfo.net.